... the first fully graphical universal
tool for the display and analysis of electrophysiological mapping
data
Explore its graphical interface:
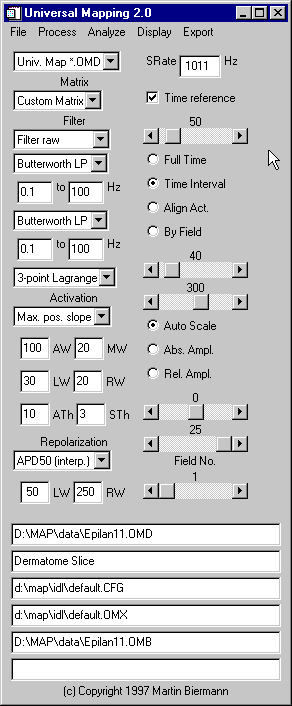
The control pad ...

... lets you:
- open binary data files
in all supported formats:
- Create your own import filter in a matter of
minutes
- A dialog box will ask you for the lenghth of the
file header in bytes (can be 0, too), the number
of channels (anything from 1 to 9999), the data
type (1 or 2-byte encoding: byte, short integer,
integer and word).
- Choose between a multiplexed format (samples are
written frame by frame from channels 0 to n-1) or
a by-channel format (samples are written channel
by channel, starting with all samples
from channel 0, followed by all samples from
channel 1 and so on.)
- Perform a byte swap if necessary (so data from all
processing platforms can be read)
- Select an appropriate number range for the
representation of amplitudes (e. g. -10 to + 10
for +/- 10 mV) and set the sample rate in Hz
- Save the filter to disk when you are happy with
the results
- Ask the developer to add your filter to the
program with the next release
- save your annotations to disk in a variety of formats
- select the file format (e. g. "Univ. Map.
*.OMD" or "Custom"
- arrange your data on the screen any way you want by
loading any of your own matrix
files (e. g. "Default" or "Custom
Matrix")
- filter data:
- Select the filter scheme and the corner
frequencies on the front panel: you can maintain
one filtered data set of the raw data
("Filter raw"), have a second filtered
data set of the raw data ("Filter raw,
raw") or filter the 1st derivative of the
filtered data set ("Filter raw,
deriv"), which is important for calculating
the second derivative.
- Choose between a variety of filters (Butterworth,
median, sliding average)
- Set the algorithm for noise-resistant calculation
of derivatives
- You can linearly interpolate signals during all
stimulation spikes to prevent inappropriate
measurements by the algorithms.
- analyze activation
times:
- Choose between a variety of algorithms such as
maximum positive slope or 50 % upstroke amplitude
for fluorescent signals, maximum negative slope
for unipolar electrograms, maximum amplitude,
maximum absolute amplitude and maximum absolute
slope for bipolar electrograms
- Interactively set all relevant parameters for
activation detection on the control pad - there
are no potentially critical parametes buried in
the source code.
- analyse repolarization times:
- Choose between a large number of algorithms such
as the maximum of the 2nd derivative, action
potential duration at 50 %, 80 % and 90 % of
repolarization with and without interpolation of
the baseline, maximum amplitude or maximum slope
in a user-definable window after each detected
activation
- reference all times displayed and output by the program
to a set reference time
- display the full length of all traces ("Full
Time"), zoom in on a set time window ("Time
interval") or align potentials on the detected times
of activation ("Align Act.) or sort them according
to each beat of a re-entrant rhythm ("By
Field"), setting the relevant times in ms by the two
sliders
- display the full amplitude of each trace ("Auto
Scale"), zoom in on a fixed amplitude interval
("Abs. Ampl.") or normalize all action
potential upstrokes to a uniform amplitude ("Rel.
Ampl."), which is the preferred way of displaying
optical action potential data.
- save all your important
settings on the front panel to a configuration file.
- see what you are doing: The bottom half of the control
pad lists the currently loaded data file
("Epilan11.OMD"), the first line of the
user-editable comment field in the OMD file header
("Dermatome Slice"), the loaded configuration
file ("default.CFG"), the loaded matrix file
("default.OMX"), the loaded mark file
("Epilan11.OMB"), the bottom line being the
status bar.
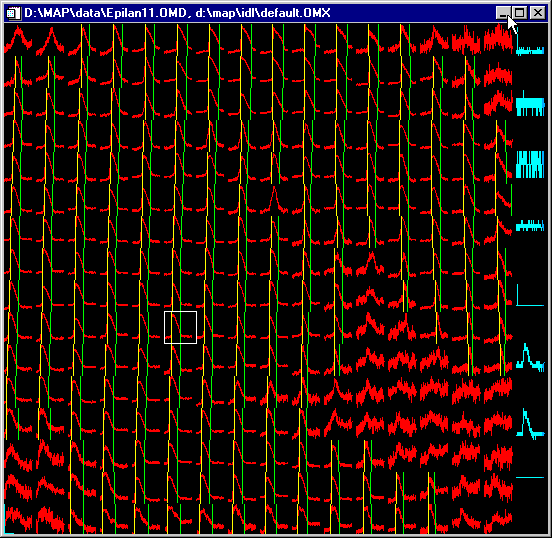
The "all traces"
window...

...lets you:
- look at all your traces
- zoom in on any time or amplitude interval
- display all activation marks (yellow bars) and/or
repolarization marks (green bars) or display just the
traces
- click on any channel with the
mouse - the white marker box will indicate the current
channel which will be displayed in the single trace
window
- external data channels are displayed in blue and excluded
from analysis
- Do you have a defect electrode channel in your electrode
matrix? No problem - just convert the channel into an
external channel on the fly - and it will be excluded
from analyis.
- The title bar tells you the names of the loaded data and
matrix files.
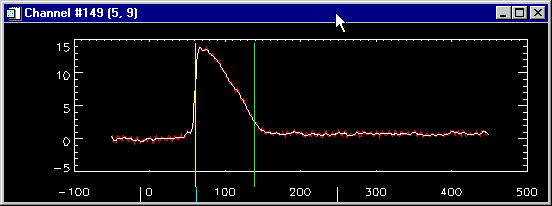
The "single
trace" window...

... lets you:
- look at each data channel - select this channel by click
on any window including color maps, contour map or movie
window. White or yellow marker boxes in each of this
windows will tell you where you are. The raw, unfiltered
trace is in red, the filtered trace in white.
- display first and 2nd derivatives of the signal
- edit all marks by simple mouse actions:
- Want to set an activation mark (yellow bar)? Just
click on the upper half of the trace, and the
program will pick the maximum slope or amplitude
(depending on the currently selected algorithm)
in the vicinity of the mouse pointer.
- Want to set a repolarization mark (green bar)?
Click on the lower half of the plot and the
program will set the repolarization mark where
you pointed at.
- To delete a mark, click on the top margin on the
window above the mark, and the closest mark will
be deleted.
- find out where you are: The title bar of the window tells
you channel number and the screen coordinates. The two
white markers at the bottom of the window indicate the
time window that is currently displayed in the all traces
window and the blue marker the current frame position of
the movie window.
The close-up window...
 ... lets you:
- get a more detailed view of the 3 by 5 channels
surrounding the currently selected channel.
- edit marks in the current channel by the same mouse
actions as in the single trace window.
- navigate the screen: Click on any channel in the close-up
window, and it will become the current channel.
The movie window...
 ... lets you:
- display potential, 1st derivative of potential and the
defibrillation field strength as a moving, color coded
display
- create animated GIF files of your data which you can then
translate into other formats such as MPG with graphics software
like Corel PhotoPaint 7: The movie that you see when you
click on the movie window represents the exciation of an
isolated superfused epicardial dermatome slice of
myocardium which is stimulated at its left lower corner
with an island of connective tissue on the right edge of
the preparation, around which the excitation propagetes.
- set speed of the movie display
- select a given frame to display
- set the compression (e. g. 5 data frames will be
compressed into one movie frame)
- set the size of the movie (e. g. 9 pixels per data
channel)
- look at each channel in detail by just clicking on the
movie: the channel will be displayed in the single trace
window, the current position of the movie being indicated
by a blue marker at the bottom of the single trace window
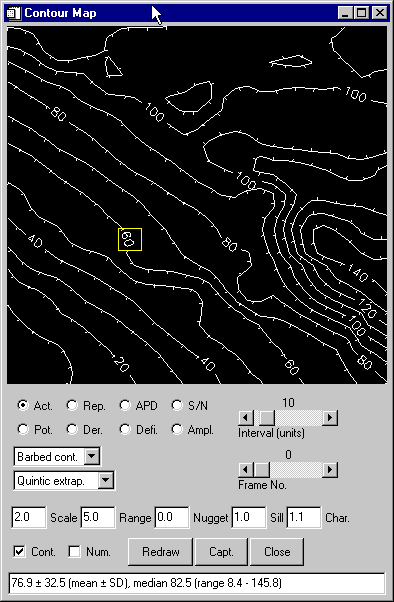
The "contour map"
window...

... lets you:
- create contour maps of all relevant parameters
(activation times, repolarization times, action potential
durations, signal-noise ratios, potential, first
derivative of the potential, defibrillation field
strength and peak-to-peak amplitudes of the signals)
- select the style of the contours (e. g.
"barbed" contours with little feet pointing
downhill, labeled or unlabeled contours, color-filled
contours for slides and presentations)
- select the interpolation and/or triangulation algorithms
(e. g. quintic extrapolation across and beyond missing
data points)
- select the interval between contours
- select the time frame for the display of potential, 1st
derivative of potential and defibrillation maps
- display contours ("Cont.") with or without
superimposed numbers at each data point
("Num.")
- capture the plot to any of
several graphics data formats for publication quality
output
- get some simple statistical data
The "Color maps"
window...

... lets you:
- review all your current activation and repolarization
marks by displaying activation times, repolarization
times and action potential durations in a color-coded
display.
- look at your data at all times - this window is refreshed
whenever you edited (set, moved or deleted) an activation
or repolarization mark.
- The slider below each plot sets the time interval that is
represented by the color wedge at the at the bottom of
the window. The first activation or repolarization times
and the shortest action potential duration is encoded by
the colors at the left edge of the wedge, the last by the
colors on the right. To allow you to spot outliers more
easily, the first time is always encoded in yellow and
the last in green.
The "file header"
window...
 ... lets you:
- look at all the data file header entries
- edit the comment header entry (e. g. "Dermatome
slice") and save it to disk
- save any imported data file (either the full length of
the file or just a time window) as a native OMD file to
disk
[Back to Home Page]
Send mail to BiermaM@uni-muenster.de with
questions or comments about this web site.
Copyright © 1997 Martin Biermann, M. D.


 ... lets you:
 ... lets you:

 ... lets you: